
TL;DR:
- Customer lifetime value (CLV) is crucial for profitable SaaS growth and guiding investment decisions.
- Accurate CLV calculation involves segmented cohort analysis and gross margin adjustments.
- Regularly updating and stress-testing CLV models prevents misaligned strategies and maximizes growth potential.
Customer lifetime value (CLV) is the number that separates SaaS companies that scale profitably from those that burn through capital and wonder why growth stalls. Picture a founder pouring budget into paid acquisition, hitting impressive sign-up numbers, then discovering six months later that most of those customers churned before the business recovered its acquisition cost. That scenario plays out constantly. The good news is that a precise, well-structured approach to CLV calculation eliminates the guesswork, sharpens every investment decision, and gives you the financial clarity to grow with confidence.
Table of Contents
- What is SaaS customer lifetime value and why does it matter?
- Key formulas and approaches for SaaS CLV calculation
- Practical steps: how to calculate and forecast SaaS CLV
- Applying CLV insights: LTV:CAC ratio, CAC payback, and business decisions
- Common errors and advanced tips for robust CLV calculation
- The uncomfortable truth about CLV: why precision is a growth multiplier
- Take your SaaS growth further with advanced marketing strategies
- Frequently asked questions
Key Takeaways
| Point | Details |
|---|---|
| CLV powers growth decisions | A precise CLV calculation ensures smarter, more profitable SaaS marketing and sales investments. |
| Profit-based LTV is essential | Incorporate gross margin to avoid overstating your customer value and optimise acquisition spend. |
| Cohort analysis reveals churn risks | Tracking CLV by cohort uncovers lifecycle churn patterns and stops costly reporting errors. |
| LTV:CAC ratio benchmarks matter | Target a 3:1 LTV:CAC ratio and fast CAC payback for investor confidence and healthy growth. |
| Refine methods regularly | Update your CLV methods as your data matures and your SaaS business evolves. |
What is SaaS customer lifetime value and why does it matter?
CLV, sometimes called LTV, is the total net revenue a customer generates during their entire relationship with your business. It sounds straightforward. In practice, most SaaS teams calculate it badly, and that error cascades into flawed marketing budgets, mispriced acquisition strategies, and retention programmes that target the wrong segments.
As CLV represents total revenue generated during a customer’s full engagement with your SaaS business, it is arguably the single most important metric for unit economics. It tells you how much you can safely spend to acquire a customer and still remain profitable. It informs how aggressively you can invest in retention. It shapes your entire go-to-market model.
Here is what goes wrong when SaaS teams rely on rough averages:
- Overestimating CLV leads to overspending on customer acquisition, burning cash on customers who will churn quickly.
- Underestimating CLV causes under-investment in high-value segments, leaving revenue on the table.
- Ignoring churn dynamics produces a static CLV figure that bears no resemblance to reality, particularly if churn spikes at specific lifecycle stages.
- Averaging across all segments masks the fact that enterprise customers and SMB customers often have radically different lifetime values.
“The difference between a SaaS business that scales and one that stalls is rarely the product. It is almost always the precision of the unit economics behind every growth decision.”
Pro Tip: Segment your CLV by customer tier, acquisition channel, and contract type from day one. A single blended CLV number is almost always misleading.
Understanding CLV also feeds directly into your SaaS marketing ROI strategies, ensuring that every pound spent on growth has a measurable, justifiable return.
Key formulas and approaches for SaaS CLV calculation
Having established why CLV is vital, let us examine the most robust calculation methods available to SaaS leaders.
There are three primary models worth knowing. Each has its place depending on your data maturity and business stage.
1. Simple churn-based formula
The most common starting point is: Average MRR per customer ÷ Monthly churn rate. If your average MRR per customer is £200 and your monthly churn rate is 2%, your CLV is £10,000. It is quick and useful for early-stage businesses with limited data. The flaw is that it assumes churn is constant, which is rarely true.
2. Gross margin-adjusted formula
A more reliable approach adjusts for profitability. As unit-economics-oriented LTV is often calculated as (Average MRR per customer × Gross margin %) ÷ Monthly churn rate, this version reflects what you actually keep, not just what you invoice. If your gross margin is 75%, that £10,000 revenue-based CLV becomes £7,500 in real terms. That distinction matters enormously when you are deciding how much to spend on acquisition.
3. Cohort-based CLV
This is the most sophisticated and accurate approach. Cohort-based CLV tracks cumulative revenue by acquisition cohort over time, making it the most accurate and actionable method available. You group customers by the month or quarter they joined, then track their actual revenue contribution over 12, 24, or 36 months. This reveals churn patterns that averages completely obscure.
| Method | Accuracy | Data required | Best for |
|---|---|---|---|
| Simple churn-based | Low to medium | MRR, churn rate | Early-stage, quick estimates |
| Gross margin-adjusted | Medium to high | MRR, churn, COGS | Growth-stage, unit economics |
| Cohort-based | High | Full billing history | Scaling, investor reporting |
- Identify which formula matches your current data availability.
- Build a gross margin-adjusted model as your baseline.
- Layer in cohort analysis as your customer base matures.
- Cross-reference both models to validate your assumptions.
- Document your methodology so comparisons remain consistent over time.
Pro Tip: If you are preparing for a funding round, investors will scrutinise your CLV methodology. A cohort-based model with gross margin adjustment signals financial rigour and earns credibility.
Pair your CLV models with robust SaaS marketing analytics reporting to ensure the data feeding your calculations is clean, consistent, and actionable.
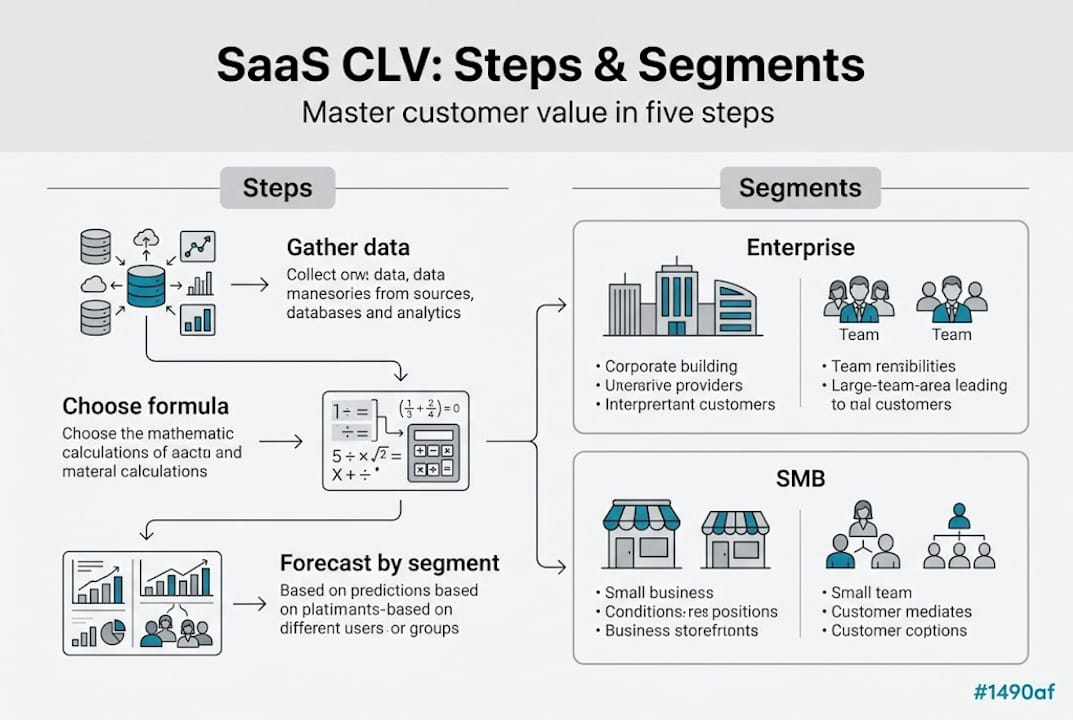
Practical steps: how to calculate and forecast SaaS CLV
With theory in place, here is how to apply these formulas and methods in your business.
Step 1: Gather the right data
You need four core inputs: monthly recurring revenue (MRR) per customer, monthly churn rate, gross margin percentage, and customer segmentation data. Without clean segmentation, you will be averaging across groups that behave completely differently. Pull this data from your billing system, CRM, and finance records. Reconcile discrepancies before you calculate anything.
Step 2: Calculate using the most applicable formula
Start with the gross margin-adjusted formula for an immediate, reliable baseline. Then build cohort tables in a spreadsheet or analytics tool, grouping customers by acquisition month and tracking their cumulative revenue contribution at 3, 6, 12, and 24-month intervals. The gap between your formula-based CLV and your cohort-based CLV will reveal where your assumptions are weakest.

Step 3: Incorporate predictive analytics
Static formulas have a ceiling. Predictive CLV models move beyond static churn assumptions by using analytics that model churn likelihood and spending or retention probabilities at the individual customer level. This means you can identify which customers are likely to expand, which are at risk of churning, and where to focus retention investment before the damage occurs.
Step 4: Forecast CLV by segment
Run your CLV calculation separately for each meaningful segment: enterprise vs. SMB, annual vs. monthly contracts, different acquisition channels. You will almost certainly find that enterprise customers have a CLV three to five times higher than SMB customers. That finding alone can reshape your entire go-to-market strategy.
| Segment | Avg MRR | Gross margin | Monthly churn | CLV estimate |
|---|---|---|---|---|
| Enterprise | £2,000 | 80% | 0.5% | £320,000 |
| Mid-market | £500 | 75% | 1.2% | £31,250 |
| SMB | £100 | 70% | 3.5% | £2,000 |
Step 5: Verify and iterate
CLV is not a set-and-forget metric. Review it quarterly. When you change pricing, launch a new product tier, or shift acquisition channels, your CLV assumptions need revisiting. Build a review cadence into your financial planning calendar.
Understanding your customer journey data strategies is essential here, as the quality of your CLV calculation depends entirely on the quality of the data you collect at each stage of the customer lifecycle. Equally, any work you do on increasing SaaS MRR will directly improve your CLV figures, making it a compounding investment.
Applying CLV insights: LTV:CAC ratio, CAC payback, and business decisions
Once you have a solid handle on your CLV, strategic deployment of those insights is the next step.
The LTV:CAC ratio compares the lifetime value of a customer to the cost of acquiring them. It is one of the most widely used benchmarks in SaaS finance. A 3:1 LTV:CAC ratio is the widely accepted investor and unit-economics benchmark, and many SaaS leaders also factor in CAC payback time as a secondary measure of capital efficiency.
Here is what the ratio tells you in practice:
- Below 1:1: You are losing money on every customer. Stop scaling until you fix this.
- 1:1 to 2:1: Marginal. Growth is possible but capital-intensive and risky.
- 3:1: Healthy. You have room to invest in acquisition and retention confidently.
- Above 5:1: Strong, but consider whether you are underinvesting in growth.
CAC payback period, the number of months it takes to recover your acquisition cost, is equally important. Top-quartile public SaaS companies have substantially faster median CAC payback than bottom-quartile companies, which directly affects cash flow and the speed at which you can reinvest in growth.
“Knowing your LTV:CAC ratio is not just a reporting exercise. It is the lens through which every marketing, sales, and product investment decision should be evaluated.”
CLV insights also shape your SaaS sales benchmarks and give you the data to justify where to focus your sales team’s effort. High-CLV segments deserve more sales resource, longer nurture sequences, and stronger onboarding investment. Equally, understanding your CLV by channel helps you identify which acquisition sources are genuinely profitable and which are eroding your unit economics. This feeds directly into strategies for lowering SaaS CAC, where even a 10% reduction in acquisition cost can dramatically improve your LTV:CAC ratio across the board.
Common errors and advanced tips for robust CLV calculation
To make your CLV calculations robust and futureproof, be aware of the most common missteps and advanced best practices.
Pitfall 1: Using average churn across all segments
Constant-churn shortcuts can fail when churn is not stable across your customer base. If SMB customers churn at 5% monthly and enterprise customers churn at 0.5%, blending those into a single churn rate produces a CLV figure that is wrong for every segment. Always calculate churn by cohort and segment.
Pitfall 2: Ignoring gross margin
Revenue-based LTV can overstate unit economics if you ignore gross margin or cost of goods sold. A customer generating £500 MRR with a 40% gross margin is worth far less than a customer generating £300 MRR with an 85% gross margin. Always use profit-based LTV when optimising CAC and marketing spend.
Pitfall 3: Treating CLV as a static number
Your CLV changes as your product evolves, your pricing shifts, and your customer mix changes. Treating last year’s CLV as gospel this year leads to misallocated budgets and missed signals.
Best practices to implement now:
- Run cohort analysis monthly to spot lifecycle churn spikes early.
- Build scenario models showing CLV under optimistic, base, and pessimistic churn assumptions.
- Revisit your gross margin calculation whenever you change infrastructure or support costs.
- Align your CLV methodology with your finance team so everyone is working from the same numbers.
- Use CLV segmentation to prioritise product roadmap decisions, not just marketing spend.
Pro Tip: Scenario analysis is one of the most underused tools in SaaS financial planning. Model what happens to your LTV:CAC ratio if churn increases by 1% or if gross margin drops by 5%. Those scenarios often reveal vulnerabilities before they become crises.
All of this connects to your broader ambitions around scaling B2B SaaS, where CLV precision becomes the foundation for confident, data-driven scaling decisions.
The uncomfortable truth about CLV: why precision is a growth multiplier
Most SaaS teams calculate CLV once, put a number in a deck, and move on. That is not analysis. That is theatre.
The teams that genuinely use CLV as a growth lever treat it as a living model, one that is updated regularly, stress-tested against real cohort data, and used to challenge assumptions across every department. We have seen founders recalculate their CLV with proper gross margin adjustment and cohort segmentation, only to discover that their most aggressively marketed customer segment was actually their least profitable. That single insight redirected an entire quarter’s marketing budget and improved their LTV:CAC ratio within 90 days.
The uncomfortable truth is that imprecise CLV does not just produce wrong numbers. It produces wrong strategies. When you overestimate CLV, you justify acquisition spend that destroys value. When you underestimate it, you pull back on growth that would have compounded beautifully.
Precision CLV also reveals expansion revenue opportunities that blended averages hide entirely. When you track cohorts properly, you can see exactly when customers tend to upgrade, when they go quiet, and when they are most likely to churn. That intelligence, applied to your customer success and product teams, creates compounding retention improvements that a single CLV formula could never surface.
For SaaS founders who are serious about building durable, scalable businesses, the investment in CLV precision is not optional. It is the difference between growing confidently and growing blind.
Take your SaaS growth further with advanced marketing strategies
Ready to translate your new CLV mastery into sustainable SaaS growth? Understanding your customer lifetime value is the starting point, but applying it effectively across your marketing, sales, and retention strategies is where the real gains compound. Our SaaS marketing strategies are built around exactly this kind of data-driven precision, helping founders move from insight to execution without losing momentum. Explore our digital marketing plans for SaaS to see how CLV-informed targeting can reshape your acquisition economics. If conversion is your immediate priority, our guide to boosting SaaS conversions gives you actionable steps to improve the return on every pound you spend attracting new customers.
Frequently asked questions
What is the best way to handle high early churn in CLV calculations?
Cohort-based analysis is the most reliable approach for high early churn, as it captures how churn varies across different lifecycle stages rather than averaging it out. Cohort-based CLV is the most accurate method for tracking churn variation over time.
Should I use revenue or profit for SaaS CLV?
You should always use gross margin-adjusted profit rather than raw revenue, as revenue-based CLV overstates the true value of a customer. Profit-based LTV is more accurate for SaaS unit economics and essential for making sound CAC decisions.
What is a good LTV:CAC ratio for SaaS?
A 3:1 LTV:CAC ratio is the widely accepted benchmark for sustainable, healthy SaaS growth. As noted by Stripe, this ratio signals that your business generates sufficient lifetime value to justify and sustain acquisition investment.
How often should I update my CLV calculations?
Review and update your CLV calculations at least quarterly, and immediately whenever you make significant changes to pricing, packaging, or your customer acquisition mix.
Can predictive analytics improve CLV accuracy?
Yes, significantly. Predictive CLV models use analytics to estimate future customer worth by factoring in churn likelihood and expansion probabilities, producing a far more nuanced and actionable figure than static formula-based approaches.