
TL;DR:
- Pipeline velocity measures deal movement speed and connects marketing output to revenue results.
- Accurate inputs and segmentation are essential for reliable, actionable insights from velocity metrics.
- Velocity should be tracked regularly as a diagnostic tool, not just a performance indicator.
Your pipeline is generating qualified leads. Your marketing team is hitting its targets. Yet revenue still feels like it’s moving through mud. This is one of the most common frustrations we see among SaaS founders and revenue leaders. The problem is rarely a lack of activity. It’s a lack of visibility into how efficiently revenue moves through your sales process. Pipeline velocity gives you that visibility. It connects marketing output to actual revenue outcomes, in a single, trackable number that tells you exactly where to focus your improvement efforts.
Table of Contents
- What is pipeline velocity and why does it matter?
- Inputs: Building blocks of the SaaS pipeline velocity formula
- Applying the pipeline velocity formula: Step-by-step guide
- Troubleshooting: Common mistakes and pipeline velocity pitfalls
- Debugging pipeline velocity: Advanced segmentation for actionable insights
- Why most SaaS teams misread pipeline velocity—and how to get meaningful results
- Take pipeline velocity further with expert strategies
- Frequently asked questions
Key Takeaways
| Point | Details |
|---|---|
| Understand velocity formula | The SaaS pipeline velocity formula links opportunities, deal size, win rate, and sales cycle length to revenue throughput. |
| Use precise input definitions | Accurate results depend on counting only sales-qualified opportunities and using closed-won deals for deal size and win rate. |
| Analyse velocity directionally | Pipeline velocity works best as a trend metric to diagnose change, not as a fixed standard for comparison. |
| Segment for actionable insights | Break velocity down by channel or persona to uncover bottlenecks and direct optimisation efforts. |
| Avoid common calculation errors | Mistakes like mixing deal types or including unqualified leads distort results and undermine improvement. |
What is pipeline velocity and why does it matter?
Pipeline velocity measures how quickly deals move through your pipeline and convert into revenue. It answers a deceptively simple question: how much revenue are you generating per day from your current pipeline?
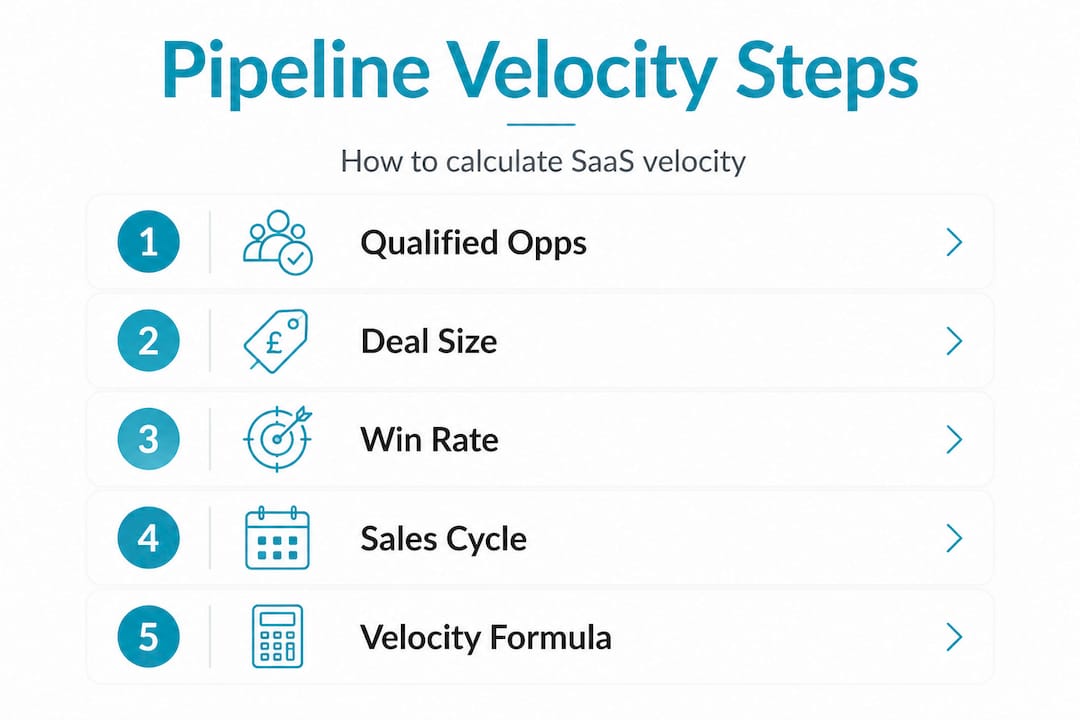
The pipeline velocity formula is calculated as follows:
Pipeline Velocity = (Number of Qualified Opportunities × Average Deal Size × Win Rate) ÷ Sales Cycle Length
Each element is a lever. Pull one in the right direction and your velocity increases. Let’s be direct about why this matters. Most SaaS teams track win rate in isolation, or obsess over deal size without understanding how cycle length neutralises gains. Velocity pulls all four inputs together into a single, directional number.
Here’s how the four levers interact:
| Lever | What it measures | What improving it looks like |
|---|---|---|
| Qualified opportunities | Volume of viable deals | Better lead qualification at the top of funnel |
| Average deal size | Revenue per closed deal | Upsells, pricing strategy, or moving upmarket |
| Win rate | Percentage of deals closed | Improved sales process, better fit targeting |
| Sales cycle length | Days from opportunity to close | Removing friction, faster decision-making |
The real diagnostic value is not in a single snapshot. Trend analysis matters far more than the absolute figure. If your velocity drops from £4,200 per day to £3,600 over two months, that signals a problem worth investigating, even if you cannot immediately point to the cause.
“Pipeline velocity is most useful as a directional metric. Track it over time, and you’ll see patterns that no individual KPI reveals on its own.”
Velocity also connects directly to your digital marketing workflow for SaaS, because every campaign you run affects one or more of its four levers. It’s the bridge between marketing activity and revenue impact. For context, it pairs well with your LTV to CAC ratio for SaaS, giving you a fuller picture of both acquisition efficiency and revenue throughput.
Inputs: Building blocks of the SaaS pipeline velocity formula
Precision in your inputs is everything. Garbage in, garbage out. The formula only works if each input is defined consistently and pulled from reliable data.
CRM-derived definitions for opportunity, deal size, and win rate are the foundation for any meaningful velocity calculation. Here is how to define each one:
| Input | Correct definition | Common mistake |
|---|---|---|
| Qualified opportunities | Sales-qualified leads (SQLs) only | Including MQLs or early-stage prospects |
| Average deal size | Mean value of closed-won contracts | Using pipeline value or projected deals |
| Win rate | Closed-won ÷ total closed opportunities | Using total pipeline instead of closed deals |
| Sales cycle length | Average days from SQL to closed-won | Using lead creation date instead of SQL date |
Getting these definitions right is not optional. It’s the difference between a metric that guides decisions and one that misleads them.
Follow these steps to set up your inputs correctly:
- Define your SQL criteria clearly. Work with your sales team to agree on a consistent definition. Opportunities that don’t meet your SQL threshold should not enter the velocity calculation.
- Pull deal size from closed-won records only. Open opportunities and projected values are speculative. Use only actual closed revenue.
- Calculate win rate from completed deal cycles. Divide the number of closed-won deals by the total number of opportunities that reached a close decision, including losses.
- Set a consistent time window for cycle length. Measure from the date an opportunity becomes SQL-qualified to the date it closes. Be consistent about this start point across your CRM.
Good reporting on SaaS marketing analytics is essential here. Your CRM must be clean and your team must log stages consistently. If your data hygiene is poor, your velocity number will be unreliable. Fixing data quality is not a nice-to-have; it is a prerequisite for using this formula effectively.

Pro Tip: Run a quarterly audit of your CRM opportunity stages to catch deals that have stalled, been miscategorised, or sit in the pipeline well past a realistic close date. Stale deals inflate your opportunity count and deflate your win rate simultaneously.
Velocity also informs your SaaS MRR growth strategy, because faster pipeline throughput at consistent deal sizes directly accelerates your monthly recurring revenue trajectory.
Applying the pipeline velocity formula: Step-by-step guide
Here is how to run the calculation from scratch, with realistic numbers to illustrate each step.
- Export your CRM data for a defined period. Use the last 90 days as your baseline. Shorter windows give you noise; longer windows obscure recent trends.
- Count your qualified opportunities. Say you had 80 SQLs enter the pipeline over that period.
- Calculate average deal size. If your closed-won deals in the same period totalled £400,000 across 40 deals, your average deal size is £10,000.
- Calculate your win rate. If you closed 40 deals out of 80 that reached a close decision, your win rate is 50%, or 0.5.
- Calculate average sales cycle length. If the average time from SQL to close was 45 days, that is your cycle length.
- Apply the formula. (80 × £10,000 × 0.5) ÷ 45 = £400,000 ÷ 45 = £8,889 per day.
That figure, roughly £8,889 in daily revenue throughput, is your pipeline velocity. Now here is the critical point. That number by itself tells you very little. What matters is whether it is trending up or down, and which lever is responsible.
Pipeline velocity should be used directionally, not as an absolute benchmark. Compare your velocity month over month. If it drops, ask which input changed. Did you bring in fewer qualified opportunities? Did your win rate slip? Did your average cycle length extend?
To ground this in reality, consider two archetypes. A mid-market SaaS business with £8,000 to £15,000 average deal sizes and 30 to 60 day cycles will have a very different velocity figure to an enterprise team with £80,000 average deals and 180 day cycles. The formula works for both. The interpretation must account for context.
You can integrate these calculations directly into your CRM or use dedicated pipeline velocity tools to automate the tracking. Automation removes the manual burden and ensures you are working from consistent data every time you check the metric.
Troubleshooting: Common mistakes and pipeline velocity pitfalls
Once you start tracking velocity, you’ll encounter data quality issues that distort the number. Recognising them early saves you from making decisions on bad information.
Common errors that distort velocity include inflating opportunity counts with unqualified deals and mixing deal segments with very different cycle lengths or deal sizes.
Here are the most frequent pitfalls and how to avoid them:
- Including unqualified leads in your opportunity count. This inflates the numerator while suppressing your win rate, making it appear that you have a qualification problem when you don’t.
- Mixing SMB and enterprise deals in a single calculation. A £2,000 SMB deal with a 14-day cycle and an £80,000 enterprise deal with a 150-day cycle are different animals. Averaging them together produces a velocity figure that accurately describes neither segment.
- Using pipeline value instead of closed-won deal size. Open deals have not yet been won, so their value is speculative. Pulling from closed-won records only keeps your average deal size grounded in reality.
- Changing your SQL definition mid-calculation. If you tighten your qualification criteria, your opportunity count will drop, and your velocity number will shift even if your sales process hasn’t changed at all.
- Ignoring seasonality. A velocity drop in August may reflect reduced buyer activity, not a broken sales process. Always contextualise trends against historical seasonal patterns.
“The most dangerous velocity number is the one that looks healthy because it’s been calculated with the wrong inputs.”
Pro Tip: Create separate velocity calculations for each customer segment you serve. SMB, mid-market, and enterprise pipelines should each have their own velocity tracking. This gives you a much more actionable diagnostic view than a blended company-wide figure.
When you benchmark your velocity against SaaS lead to close rate benchmarks, you can identify whether your close rate relative to industry norms is contributing to a velocity problem. Pair this with a review of your B2B SaaS lead generation approach to ensure the right volume of qualified opportunities is entering the top of your pipeline in the first place.
Debugging pipeline velocity: Advanced segmentation for actionable insights
Once you have a reliable baseline velocity figure, segmentation is where the real analytical power comes in. A single company-wide number tells you that something is wrong. Segmented numbers tell you where and why.
Pipeline velocity is most useful as a system-level metric, and the best way to debug it is through segmentation and stage-by-stage conversion analysis.
Here is how to approach segmentation practically:
| Segment type | What it reveals | Action it enables |
|---|---|---|
| By channel (PPC, organic, outbound) | Which sources generate the fastest-closing, highest-value deals | Reallocation of marketing budget |
| By persona or buyer role | Which audiences convert fastest and at what deal size | Refined targeting and messaging |
| By deal type (new vs expansion) | Whether expansion revenue outperforms new logo velocity | Shift focus toward customer success-led growth |
| By geography or region | Whether velocity differs across markets | Territory-specific sales investment |
Channel-level segmentation is particularly powerful for revenue leaders who want to connect marketing spend to pipeline outcomes. If your PPC campaigns for SaaS consistently produce deals that close in 28 days compared to 55 days from outbound, that gap has significant velocity and budgeting implications.
Stage-level analysis adds another layer. Review your stage conversion rates and stage ageing alongside velocity. If deals are stalling consistently at the proposal stage, your overall velocity will suffer even if your top-of-funnel numbers are strong. Stage ageing reports in your CRM will show you exactly which stage is acting as a bottleneck.
Use these insights to direct improvement efforts precisely:
- If win rate is the weak lever, focus on sales enablement and qualification tightening.
- If cycle length is the problem, examine where deals stall and introduce process changes to remove friction at those specific stages.
- If opportunity volume is low, the issue sits in marketing, not sales.
- If average deal size is suppressing velocity, revisit your pricing strategy or consider moving upmarket.
Segmented velocity analysis transforms a single number into a practical diagnostic system for your entire revenue operation.
Why most SaaS teams misread pipeline velocity—and how to get meaningful results
Here is an opinion that tends to surprise people: most SaaS teams that track pipeline velocity are getting minimal value from it, not because the metric is flawed, but because they treat it as a performance score rather than a diagnostic instrument.
We see this regularly. A team calculates velocity, sees a number that is higher than last quarter, and declares success. Nothing changes. No process is examined. No lever is deliberately pulled. The metric sits in a dashboard looking healthy while slow-moving deals quietly erode revenue potential.
Context and trend matter far more than raw numbers. The founders and revenue leaders who extract genuine value from velocity are those who review it in motion, asking “what changed and why?” rather than “is this good or bad?”
The second misreading is assuming that increasing one lever will linearly improve velocity. In practice, the levers interact. Aggressively increasing opportunity volume without tightening qualification will lower your win rate and potentially extend your cycle, cancelling out any velocity gain. The formula rewards balance, not maximising individual inputs.
The third and most costly mistake is using a single blended velocity figure to make investment decisions. If your enterprise segment has a velocity of £22,000 per day and your SMB segment sits at £1,200 per day, a blended figure of £8,000 obscures the real story. Your capital, your sales resource, and your marketing spend deserve more precise direction than that.
The practical wisdom here is this. Build velocity as a monitoring habit, not a reporting exercise. Set a consistent cadence. Segment from the start. When velocity shifts, treat it as a signal to investigate, not a verdict to celebrate or defend. Pair it with your data-driven SaaS marketing plan so that every campaign you launch is connected to a specific lever you are trying to move.
That is what separates teams who merely measure pipeline velocity from those who actually improve it.
Take pipeline velocity further with expert strategies
Understanding the pipeline velocity formula is the first step. Putting it to work consistently, across your marketing channels, CRM processes, and sales stages, is where the real revenue gains come from. At Media House Agency, we specialise in connecting marketing precision to measurable sales outcomes for SaaS founders and revenue leaders who are serious about scaling efficiently. Whether you need support building a data-driven SaaS marketing plan or want expert analysis of your current pipeline performance, we bring the analytical rigour and strategic focus to accelerate your results. Explore our resources and services to take the next step toward consistent, compounding pipeline velocity improvement.
Frequently asked questions
How often should SaaS teams calculate pipeline velocity?
Pipeline velocity is best tracked weekly or monthly, since it is most valuable as a directional trend metric rather than a one-time snapshot. Regular tracking ensures you catch performance shifts quickly and can act before they compound.
Should the pipeline velocity formula include unqualified deals?
No. Only sales-qualified opportunities should be included in the calculation. Adding unqualified deals distorts both your win rate and your opportunity count, making the resulting velocity figure unreliable and misleading.
How does segmenting pipeline velocity improve diagnostics?
Segmenting by channel, persona, or deal type allows you to pinpoint specific bottlenecks in your pipeline rather than treating the metric as a single blended figure. This targeted view makes your improvement efforts far more precise and effective.
Is a high pipeline velocity always better?
Not necessarily. Interpretation should always consider deal context, cycle length, and win rates across individual segments, because velocity is not absolute. A very short cycle driven by poor-fit, low-value deals can produce a deceptively high velocity figure that masks deeper revenue problems.