
TL;DR:
- Churn rates vary significantly across SaaS segments, with top performers achieving negative or low churn.
- Reducing involuntary churn through payment retries and improving onboarding are key strategies.
- Benchmark against segment-specific top quartile figures instead of industry averages to drive growth.
Most SaaS founders track churn. Far fewer benchmark it correctly. The gap between the best and worst performers is staggering: top-tier SaaS companies achieve negative churn with net revenue retention above 100%, while bottom-quartile businesses haemorrhage more than 12% of their customer base every single month. Chasing a single “average” figure without understanding your segment is one of the most common and costly mistakes in SaaS. This article breaks down what churn actually means, what the real numbers look like by segment, and what you can do to move yours in the right direction.
Table of Contents
- What is churn rate and why does it matter?
- The real numbers: Churn benchmarks by segment in 2026
- Why churn rates differ: drivers and pitfalls SaaS leaders miss
- Tactics to diagnose and beat churn: practical frameworks
- Why obsessing over an ‘average’ churn rate is holding you back
- Next steps: Level up your SaaS retention and growth
- Frequently asked questions
Key Takeaways
| Point | Details |
|---|---|
| Churn rates vary by segment | Enterprise, mid-market, SMB, and self-serve SaaS have very different churn benchmarks. |
| Median is not the full story | Top-performing SaaS firms achieve much lower churn and even negative net churn, while bottom quartile struggle above 12%. |
| Act on involuntary churn first | Fixing payment failures reduces churn by up to 40 percent and is often the easiest win. |
| Expansion revenue is key | Focusing on upsells and cross-sells can help you achieve negative net churn and drive growth. |
What is churn rate and why does it matter?
Churn rate is the percentage of customers who cancel or fail to renew within a given period. For SaaS businesses built on recurring revenue, it is arguably the most consequential metric you track. Every point of churn compounds against your growth. It erodes MRR, inflates your customer acquisition cost payback period, and quietly destroys the lifetime value projections that underpin your valuation.
Understanding the types of churn is the first step to managing it.
- Voluntary churn: Customers who actively choose to leave. This is typically driven by poor fit, weak onboarding, lack of perceived value, or competitive alternatives.
- Involuntary churn: Customers lost due to failed payments, expired cards, or billing errors. This is passive but significant.
- Gross revenue churn: The total revenue lost from cancellations and downgrades.
- Net revenue churn (or NRR): Revenue lost minus expansion revenue from upsells and cross-sells. This is where the magic happens.
“B2B SaaS average monthly churn sits at 3.5%, comprising 2.6% voluntary and 0.8% involuntary churn.”
That 0.8% involuntary figure is easy to dismiss. It should not be. For a business with 500 customers, that is four lost accounts every month from billing failures alone, accounts that likely intended to stay. Involuntary churn is fixable, and fixing it is faster than winning back disengaged customers.
Churn also has a direct bearing on how you build your SaaS customer journey strategies. If you are losing customers in month three, the problem almost certainly starts in week one. The onboarding experience, the activation moment, the first value realisation: all of these feed into whether a customer stays or leaves. Equally, customer trust in SaaS is a compounding asset. Brands that invest in it retain more, expand more, and grow faster.
The real numbers: Churn benchmarks by segment in 2026
With churn defined, let us look at what the actual numbers say by segment. Context is everything here. A 5% monthly churn rate might be catastrophic for an enterprise SaaS business and merely average for a self-serve tool with a freemium model.
Here is how the data breaks down across segments:
| Segment | ACV range | Monthly churn | Annual churn |
|---|---|---|---|
| Enterprise | >£100K | 1.5% | <10% |
| Mid-market | £10K to £100K | 3.1% | 10–20% |
| SMB | £1K to £10K | 5.2% | 30–50% |
| Self-serve | <£1K | 7.3% | 60–70%+ |
These figures are drawn from segment-specific benchmarks across thousands of SaaS businesses. The spread is enormous. Enterprise businesses at 1.5% monthly churn are operating in a fundamentally different world from self-serve products losing more than 7% of users every month.
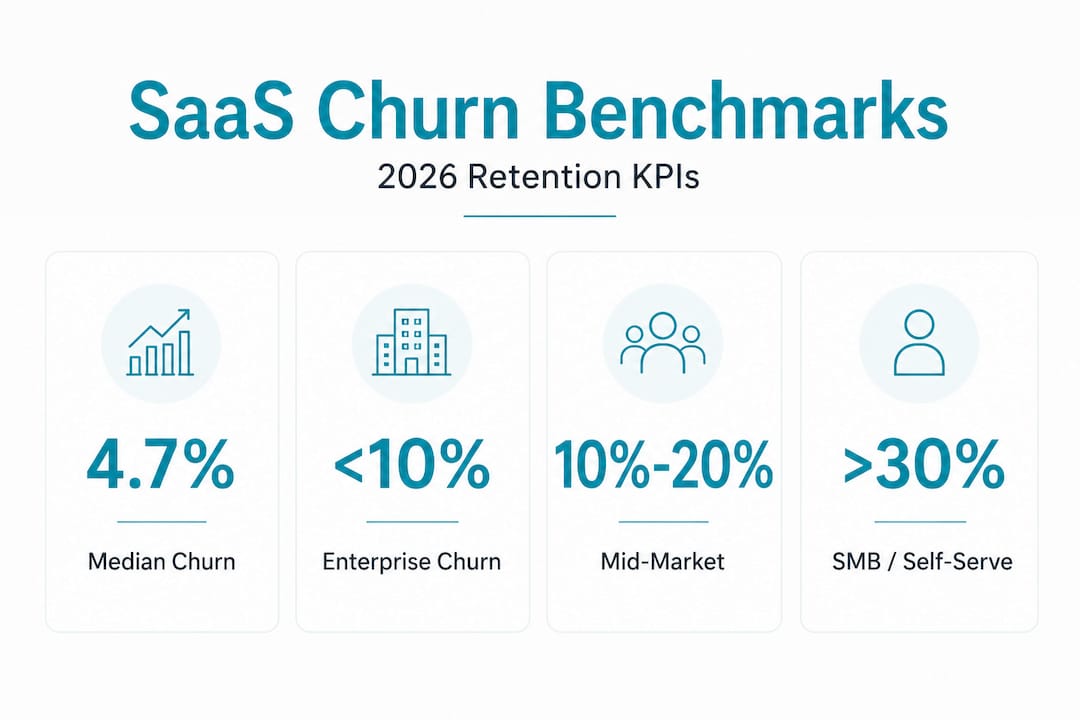
Annual churn benchmarks reinforce this picture: enterprise sits below 10%, mid-market ranges from 10% to 20%, and SMB can reach 30% to 50% annually. If you are in the SMB space and comparing yourself to enterprise benchmarks, you are setting yourself up for false confidence or unnecessary panic.
The median monthly churn across all SaaS segments is 4.7%. That number sounds manageable until you realise it masks a distribution that runs from sub-1% to well above 10%. Top-quartile performers across all segments sit below 2% monthly. Bottom-quartile businesses exceed 7% monthly. The median tells you very little about where you should be.
Statistic to keep front of mind: At 5% monthly churn, you lose roughly half your customer base every year. At 2% monthly churn, you retain roughly 79% annually. That difference, compounded over three years, is the difference between a business that scales and one that runs to stand still.

Pro Tip: Do not benchmark your churn against the industry median. Benchmark against the top quartile of your specific segment. That is the target worth chasing.
If you want to understand how churn connects to revenue growth, the path to increasing SaaS MRR runs directly through retention. Expansion revenue from retained customers is the most capital-efficient growth lever available to you.
Why churn rates differ: drivers and pitfalls SaaS leaders miss
Now that you have seen the range, it is worth understanding why rates diverge so widely. The causes are not random. They are structural, and most of them are within your control.
Pricing and ACV are the biggest structural drivers. Low-ARPA products in the £25 to £50 per month range see monthly churn averaging 7.3%. The reason is simple: switching costs are low. A customer paying £30 a month for a project management tool will cancel on a whim if the product frustrates them. A business paying £80,000 a year for an enterprise platform has deeply embedded workflows, procurement processes, and internal champions. Cancellation is a major organisational decision.
Onboarding quality is the second biggest lever. Poor onboarding is the leading cause of voluntary churn in the first 90 days. If customers do not reach their first meaningful outcome quickly, they disengage. And disengaged customers churn. This is not a product problem alone; it is a marketing and communication problem too.
Here are the most common pitfalls we see SaaS leaders fall into:
- Targeting the wrong benchmark: comparing SMB churn to enterprise averages and drawing false conclusions.
- Misreading involuntary churn as voluntary: treating payment failures as product dissatisfaction when the fix is a dunning sequence.
- Ignoring expansion revenue: focusing entirely on reducing gross churn while missing the NRR opportunity sitting inside the existing customer base.
- Conflating customer churn with revenue churn: losing ten small accounts while retaining two large ones can mean net revenue growth despite rising customer churn.
“Benchmark against your segment’s ACV and ARR stage, not blended averages. Enterprise and SMB businesses differ by 5x or more in monthly churn rates, and top-quartile performers achieve below 2% monthly through deliberate retention investment.”
Net revenue retention above 110% is the north star for high-performing SaaS businesses. It means you are growing revenue from your existing customer base even before acquiring a single new account. That is the model to build towards.
Pro Tip: Segment your churn analysis by payment behaviour as well as by customer size. Involuntary churn clusters around specific payment methods, billing cycles, and card types. Fixing these is a quick win with compounding returns.
Investing in SaaS retention tactics and optimising your digital workflow around customer success signals are two areas where the return is immediate and measurable.
Tactics to diagnose and beat churn: practical frameworks
Understanding causes is only half the battle. Here is how to systematically reduce churn using proven frameworks.
Step 1: Segment your churn data. Break churn down by customer size, ACV, acquisition channel, and product tier. Do not analyse churn as a single number. You need to know which segment is churning, when they are churning, and why.
Step 2: Quantify involuntary churn separately. Run a clean analysis of payment failures in your billing data. How many cancellations in the last 90 days were preceded by a failed payment rather than a cancellation request? This number is almost always higher than founders expect.
Step 3: Build a dunning sequence. A dunning sequence is an automated series of communications triggered by payment failure. Done well, dunning and retry cycles can reduce involuntary churn by 20% to 40%. That is a significant impact for a process that takes days to set up.
Step 4: Prioritise onboarding for high-risk segments. Use your segmented churn data to identify which customer types are most likely to churn in the first 60 days. Build targeted onboarding sequences for these groups. Personalised check-ins, in-app prompts, and early success milestones all reduce early churn materially.
Step 5: Build an expansion revenue engine. Upsells, cross-sells, and seat expansions are not just revenue tactics. They are retention tactics. Customers who expand their usage are far less likely to churn. Design your product and customer success motion to create natural expansion moments.
Here is a comparison of impact across churn reduction levers:
| Lever | Effort to implement | Typical impact on churn | Time to see results |
|---|---|---|---|
| Dunning and payment retries | Low | 20–40% reduction in involuntary churn | 30 days |
| Improved onboarding | Medium | 15–25% reduction in early voluntary churn | 60–90 days |
| Customer success outreach | Medium | 10–20% reduction in mid-lifecycle churn | 60–120 days |
| Expansion revenue focus | High | Offsets gross churn; drives NRR above 110% | 90–180 days |
NRR above 110% is achievable for most SaaS businesses with a deliberate expansion strategy. The median NRR across SaaS sits between 106% and 110%. Getting above that threshold means your existing customer base is growing in revenue terms, which fundamentally changes your growth economics.
Pro Tip: If your NRR is below 100%, you are losing ground even when you acquire new customers. Fix this before scaling your acquisition spend.
A well-constructed data-driven SaaS marketing plan should include retention KPIs alongside acquisition targets. And if you want to convert more of the customers you do acquire, improving SaaS conversion rates from trial to paid is a direct lever on the denominator of your churn calculation.
Why obsessing over an ‘average’ churn rate is holding you back
Here is the uncomfortable truth: the hunt for a single “average” SaaS churn rate is a distraction that costs founders clarity and focus.
The data sources most commonly cited, including ProfitWell, Baremetrics, OpenView, Recurly, Bessemer, and KeyBanc, are aggregated from tracked companies that skew towards businesses actively measuring their metrics. The companies not measuring churn carefully are not in these datasets. That means published averages are already optimistic relative to the full SaaS market.
More importantly, the average obscures the spread. A 4.7% median monthly churn figure tells you nothing about whether your 3.8% churn is excellent or alarming. For an enterprise SaaS business, 3.8% monthly churn is a crisis. For a self-serve tool, it might be above average performance.
The elite SaaS businesses we observe do not chase the average. They design for negative net churn from the start. They build expansion revenue into the product model, create natural upgrade paths, and invest in customer success as a revenue function rather than a cost centre. The result is that gross churn becomes largely irrelevant because expansion revenue from retained customers more than compensates.
There is also a strategic risk in comparing yourself to companies with fundamentally different models. A product-led growth tool with a freemium tier and a £29 per month entry point will always have higher churn than a high-touch enterprise platform. Comparing the two is not just unhelpful; it can lead you to make the wrong decisions about pricing, customer success investment, and growth strategy.
What matters is your trajectory within your segment. Are you moving towards the top quartile of your ACV band? Is your NRR trending upward? Is involuntary churn declining as a share of total churn? These are the questions that drive real improvement.
A strong SaaS inbound marketing strategy also plays a role here. Attracting better-fit customers through content and positioning reduces churn at the source. Customers who understand what they are buying before they sign up are far more likely to stay.
Build segment-specific KPIs. Stop competing for a low average. Start building the conditions for negative net churn.
Next steps: Level up your SaaS retention and growth
If this article has sharpened your thinking on churn, the next move is to apply it. At Media House Agency, we work with SaaS founders and marketing leaders to build retention-first growth strategies grounded in data, not guesswork. Whether you need to overhaul your SaaS marketing strategies, work through a comprehensive SaaS conversion guide to improve trial-to-paid rates, or build a sharper B2B SaaS brand that attracts higher-value customers from the outset, we bring the analytical rigour and strategic clarity that turns retention metrics into revenue growth. The frameworks exist. The data is clear. The question is whether you apply it.
Frequently asked questions
What is a good churn rate for SaaS in 2026?
A good churn rate depends on your segment, but top-performing SaaS businesses keep monthly churn below 2%, while the median across all segments sits at 4.7%.
How much churn is acceptable for enterprise SaaS?
For enterprise SaaS, monthly churn below 1.5% and annual churn under 10% are considered healthy benchmarks in 2026.
Why are SMB SaaS churn rates higher?
SMB customers have lower switching costs, smaller budgets, and less organisational inertia, which drives monthly churn to 5.2% and annual churn between 30% and 50%.
What percentage of SaaS churn is due to payment failure?
Involuntary churn from payment failures averages 0.8% monthly and accounts for 20% to 40% of total churn, making it one of the fastest fixes available.
Can SaaS companies have negative churn?
Yes. Leading SaaS businesses achieve negative net churn by growing expansion revenue faster than they lose customers, with median NRR reaching 106–110% across high-performing companies.